Feature #16630
open
QFQ Dev Panel
0%
Description
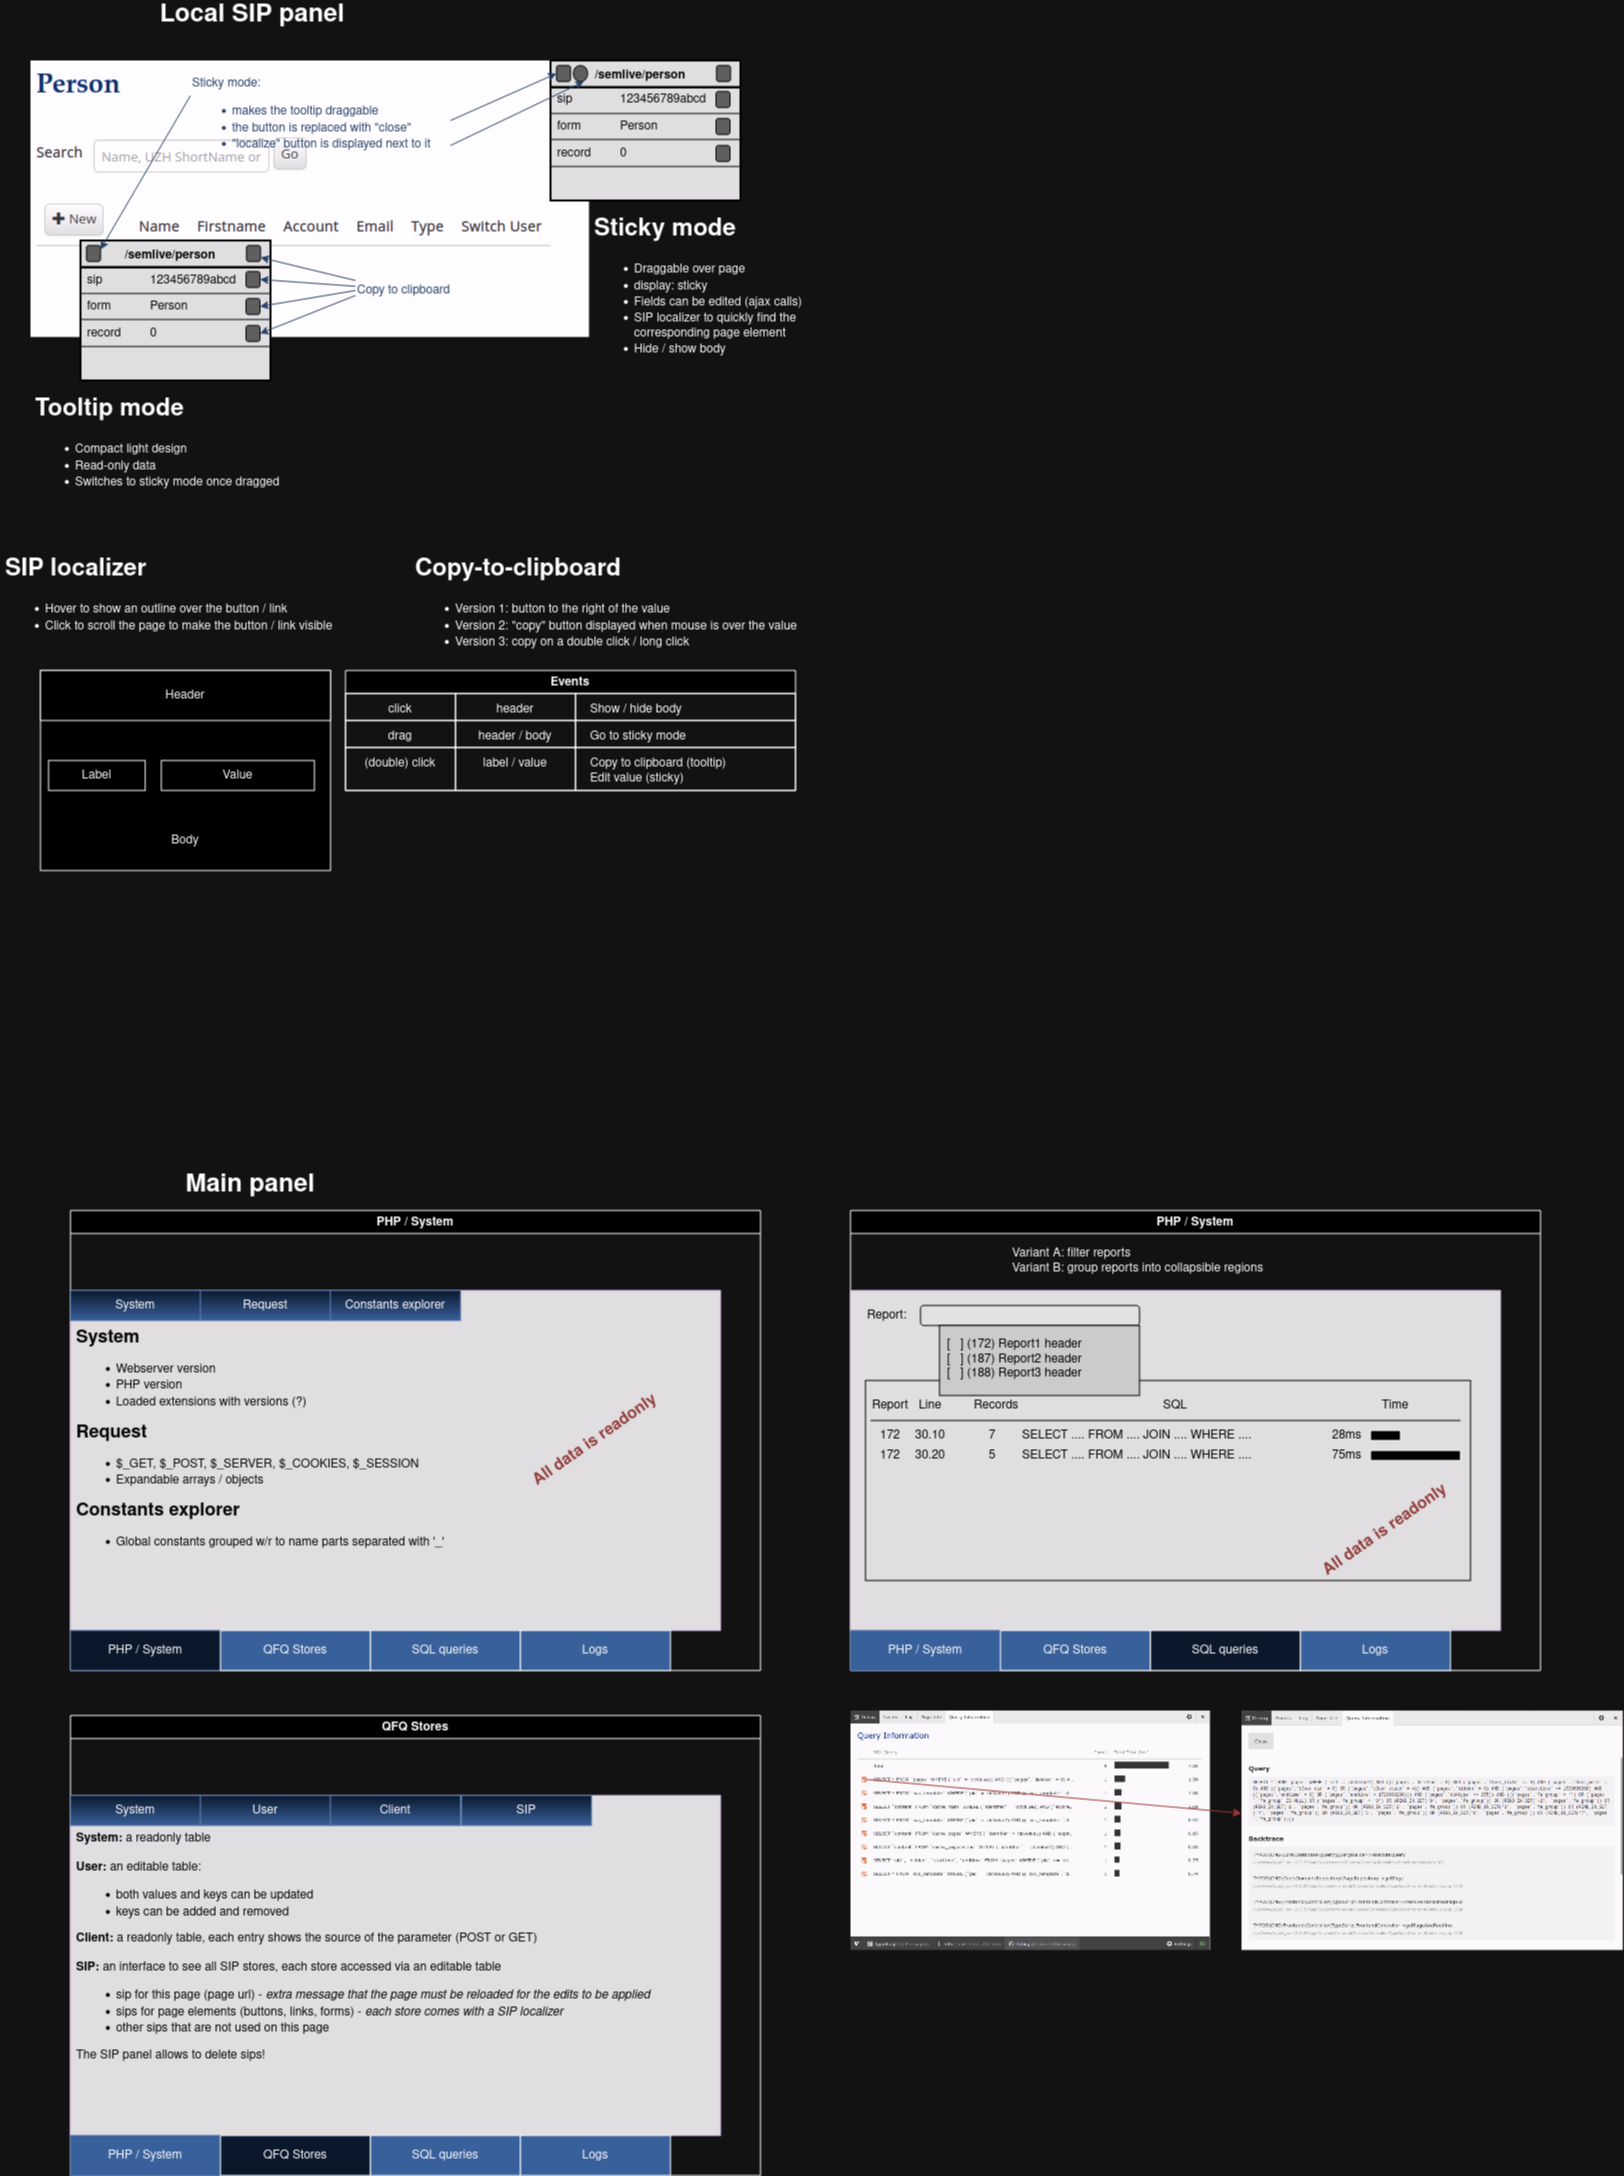
Idea: A (floating and movable/minimizable?) panel that is accessible on each page with a QFQ record, if logged in in the backend.
The panel gives access to "QFQ Dev Tools" that increase quality of life for the developer, such as:
- Display all variables per Store (C/S/U/Y/T/?)
- Allow manipulation of viariables per store, maybe a shortcut for Switch User (=setting {{feUser:U}})
- Generate and open a SIP link (by typing the link in a textbox and clicking a button next to it)
- Quick access to sql.log, qfq.log, mail.log, ideally more than the last 10 lines
- Truncate table 'Dirty'
- Quick Access to all Forms and FormElements
- Display Info (SW and Versions, e.g. QFQ Version, PHP Version, webserver, ...?)
- Show Query Times (Slow Query Detection)
Check Admin Panel in T3 for ideas
Files
| dev-panel-overview.png | View dev-panel-overview.png | 478 KB | 12.07.2024 Concept overview [PNG] | ||
| dev-panel-overview.drawio | dev-panel-overview.drawio | 335 KB | 12.07.2024 Concept overview [DrawIO] |
Related issues
 Updated by Philipp Gröbelbauer
  Updated by Enis Nuredini
 Updated by Carsten Rose 11 days ago
- Related to Feature #12532: SIP-Parameter bei Seitenaufruf in Browser-Console anzeigen added
 Updated by Zhoujie Li
 Updated by Krzysztof Putyra 6 days ago
- Related to Feature #18679: Tooltip: a) sticky, b) copy to clipboard added
Updated by Krzysztof Putyra 5 days ago
- File dev-panel-overview.png dev-panel-overview.png added
- File dev-panel.svg added
Concept discussed on 12.07.2024
Log files- lazy loading over websocket (on demand)
- for now only plain text - filtering can be implemented with more structured logs in a database (Monolog?)
- For nested blocks record the total time as well as per iteration of the parent query
- Two variants of the query: raw and with variables replaced
- values of variables can be shown in a separate table
- Do not show all stores, only for marked blocks / queries
- Keyword in the report body
- Special column in the query, such as
_debug
- Accessible from a "Report dev panel"
- For instance Report viewer tab in the pabel
- Clicking on the report debug icon opens this view for the particular report